Driver performance KPIs

Build trust and drive adoption of SIXT rides among 3P drivers by clearly communicating performance expectations.

Build trust and drive adoption of SIXT rides among 3P drivers by clearly communicating performance expectations.

Focus areas

Interaction design

User-centric design

Business acumen

Context

SIXT is a premium car rental business founded by Martin Sixt in 1912. Based out of Munich, Germany, SIXT currently operates in 105+ countries.

Other than rental cars, SIXT also offers on-demand cab hailing services called RIDE.

SIXT RIDE was facing low ride acceptance rates from third-party drivers due to a lack of trust, unclear expectations, and no performance feedback. We embedded a gamified feedback loop into the driver app using quantifiable KPIs and engaging visual cues. This system gave drivers real-time clarity on their performance, incentivized improvement, and helped build trust in the platform. As a result, driver performance significantly improved—'Perfect Rides' increased by 2.8x, and overall ride acceptance rose 2.5x within three months—directly contributing to better business outcomes for SIXT.

Orientation - SIXT RIDE ecosystem

Business map

Driver's flow

ride

SIXT's cab hailing business

🙋🏼

🙋🏼

🙋🏼

SIXT customers

SIXT app for customers

Customers can book rides

Bookings

Commission

3rd party travel service providers AKA driver companies

🧑🏼‍✈️

🧑🏼‍✈️

🧑🏼‍✈️

3rd party drivers reporting to & paid by driver companies

Averages 5 rides/day

Native language varies by location

Can be assigned rides by SIXT/driver company

SIXT app for drivers [you are here]

Drivers can accept rides

Problem space

Business acumen

For SIXT:

  • There was no mechanism in place for SIXT to communicate performance expectations to drivers.

  • Drivers are employed by third-party companies, and SIXT has no control over their compensation or how they are penalized for not meeting their performance goals.

  • Due to lack of trust and visibility, drivers often rejected SIXT rides—leading to business losses.

For drivers:

  • Drivers lacked clarity on how their performance was being evaluated.

  • They received no timely feedback to identify issues or improve.

  • Penalties were applied during monthly payouts without clear explanations.

SIXT did not directly employ or pay drivers; they were managed and compensated by partner companies. However, SIXT could penalize these companies for poor driver performance based on system metrics or customer feedback—penalties that often indirectly impacted the drivers’ payroll beyond SIXT's purview.

Competitor analysis

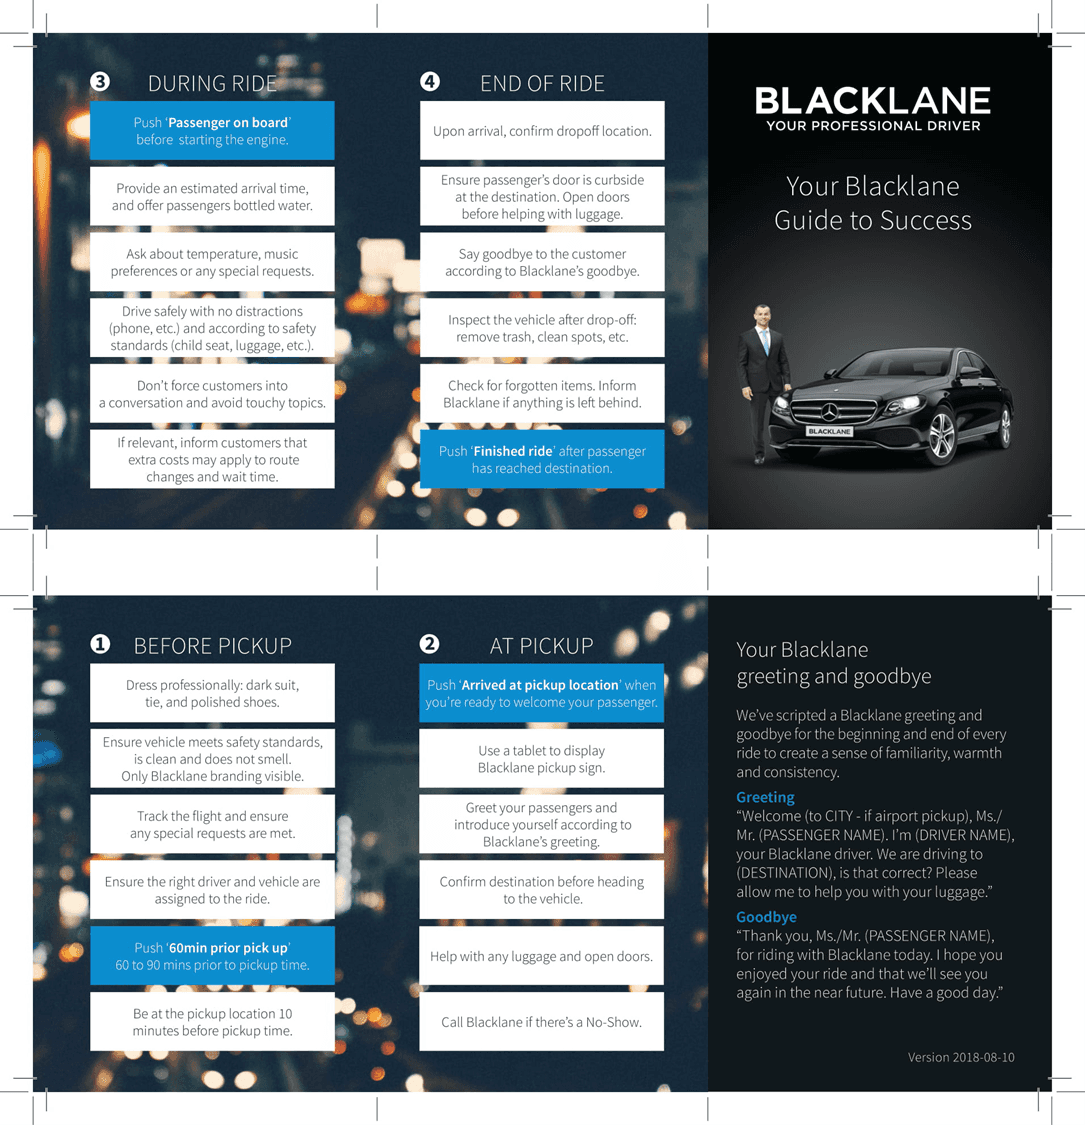
Blacklane's mantra cards:

  • Blacklane handed out printed ’Mantra’ cards to drivers.

  • The ‘Mantra’ cards outlined the expected code of conduct and instructions for every stage in an active ride.

  • This approach may have succeeded in educating the drivers, but it did not provide any feedback about their performance.

  • Printed cards are easily misplaced.

A deep understanding of the problem space and a quick competitor analysis helped us narrow down the approach.

Design brief

Design an in-app feedback system to build driver trust, clarify performance expectations, and improve ride acceptance through timely, actionable insights.

Guiding principles:

🔸

Non-intrusive so that drivers can focus on the road.

Non-intrusive so that drivers can focus on the road.

🔸

Transparency to build trust.

🔸

Positive reinforcement to encourage sustained performance.

Positive reinforcement to encourage sustained performance.

🔸

Stay incentive-neutral as drivers are not paid by SIXT.

Stay incentive-neutral as drivers are not paid by SIXT.

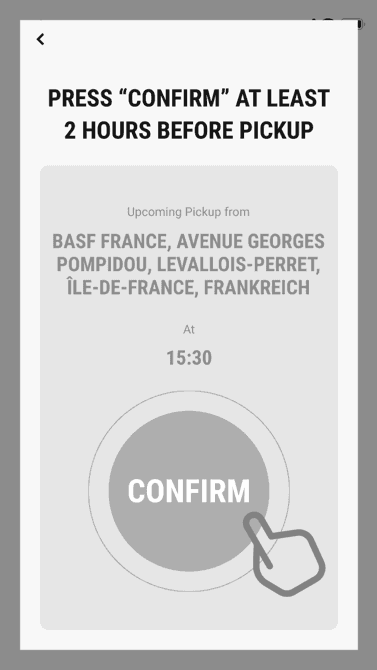
Option 1 - reminder cards before pickup
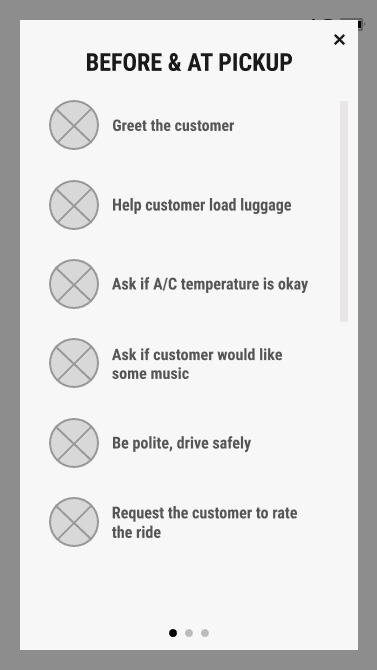
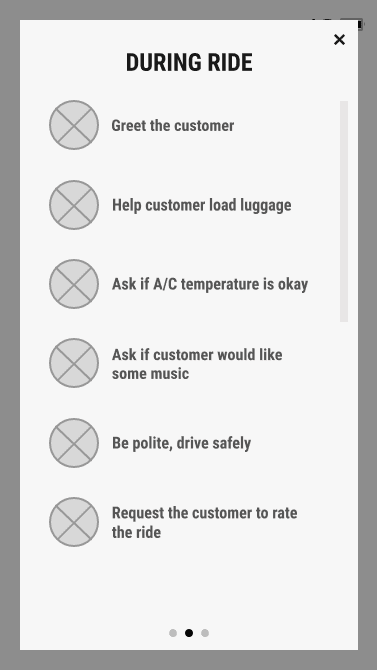
ℹ️ Explanation

Inspired by Blacklane’s physical ‘Mantra’ card, we explored a digital version to display key guidelines before each pickup. However, its limitations—being repetitive, distracting, and static—led us to drop the idea. Instead, we aimed to leverage SIXT’s driver app and existing performance signals to build a more dynamic, actionable feedback loop.

✅ Pros

Reminding the driver about the desirable code of conduct just before the passenger on-boarded would result in better performance.

⛔ Cons

Might distract the driver while driving.

Too much to read and memorize.

Will be redundant once the driver memorizes it. 

No feedback about actual performance.

Non-quantifiable pointers.

Inspiration Angry Birds

💡 Idea

We took cues from Angry Birds to design our ‘Ride Report’ that would be shown at the end of each ride.

❓ Rationale

Sense of gratification on completing each level.

Builds up excitement.

Constructive feedback.

Motivates to do better in the next level.

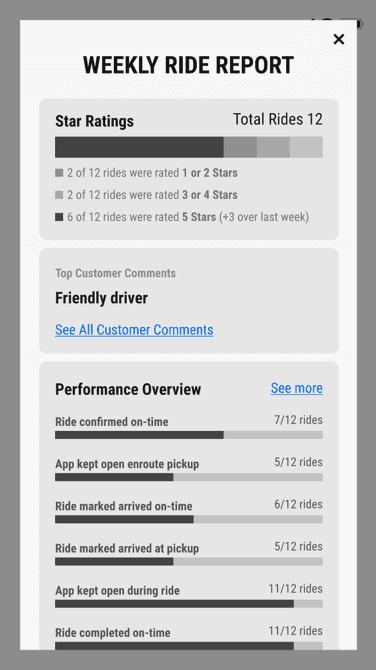
Option 2a - ride report after a ride is ended

ℹ️ Explanation

The SIXT driver app allowed us to track metrics reflecting adherence to service guidelines. I proposed a three-part solution: use quantifiable thresholds to rate rides as ‘Perfect’, ‘Average’, or ‘Poor’; show drivers exactly what went wrong; and link each issue to the relevant guideline for quick reference and improvement.

Showing this at the end of each ride would ensure minimal distraction for the driver. #non_intrusive

✅ Pros

Clear feedback about what was expected versus what was missed. #transparency

Will motivate the driver to perform better in the next ride.

Sense of accomplishment if all the expected goals were met. #positive_reinforcement

Quantifiable parameters.

⛔ Cons

System will take time to fetch and/or calculate actual performance parameters right after a ride is ended.

Option 2b - performance tracking over time
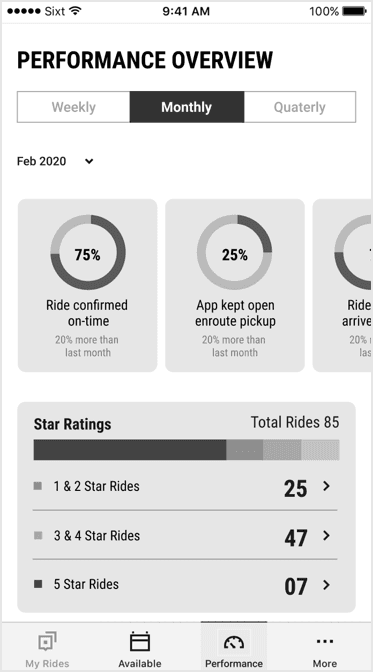
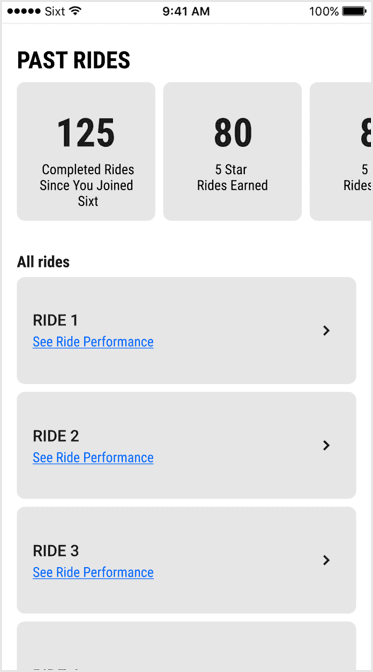
ℹ️ Explanation

In addition to the transient ride report, I proposed a persistent performance dashboard to help drivers track their progress and identify patterns over time.

✅ Pros

This will enable drivers to monitor their performance over time.

Scope for goal setting and gamification.

⛔ Cons

Drivers may not regularly review past rides unless there's a dispute; long-term tracking may be more useful for driver companies.

Communicating performance insights in multiple driver-friendly languages poses a significant localization challenge.

Consistently poor performance feedback could demotivate drivers if not framed constructively.

Launched & landed!

We launched a comprehensive in-app performance feedback system to improve driver trust and accountability without referencing payouts. Key features included:

  • Ride Report Cards – Rated each ride as Perfect, Average, or Poor based on tracked KPIs, and highlighted missed expectations with links to relevant guidelines.

  • Streaks – Motivated consistent high performance by visually rewarding consecutive quality rides.

  • Driver Company Dashboard – Gave partner companies visibility into individual and team-level performance, enabling better oversight and ride allocation.

Report card - loading screen

Animations to build anticipation

Report card - performance indicators

The moment of truth

Report card - KPI screens

Clear and accurate feedback

Performance streaks

Gamification for sustained performance

Driver company dashboard

Solidifying the trust between SIXT and partner companies, foundation for future engagement

Explorations beyond current scope

Ideas

Social validation, abstracted ride value, gamification, recognition-based incentives, access privileges, relationship meters.

Key outcomes & impact

Performance data—sourced from GPS and app logs—was mapped to system-defined KPIs to evaluate each ride.
Ride Acceptance Rate was calculated as:


(Rides Accepted ÷ Rides Offered) × 100, reflecting driver trust and engagement.

From June to September 2020:

  • Ride acceptance rate improved by ~38.72%

  • Accepted rides grew from 1,801 to 4,625 (2.5×)

  • Perfect Rides increased 2.8×, from ~56% to ~61%

While ride demand was recovering post-COVID, average and poor rides stayed flat—confirming that quality gains came from behavior change, not just market rebound.

Driver survey highlights

User-centric design

Survey delivered via in-app notifications in 5 languages: English, German, French, Italian & Spanish. A total of 268 responses were received:

  • 82% of drivers are aware of their performance goals for every SIXT ride.

  • 70% found the ride report information helpful.

  • 40% credited the ride reports for their performance improvement.

Thanks for the read!

Launched & landed!

We launched a comprehensive in-app performance feedback system to improve driver trust and accountability without referencing payouts. Key features included:

  • Ride Report Cards – Rated each ride as Perfect, Average, or Poor based on tracked KPIs, and highlighted missed expectations with links to relevant guidelines.

  • Streaks – Motivated consistent high performance by visually rewarding consecutive quality rides.

  • Driver Company Dashboard – Gave partner companies visibility into individual and team-level performance, enabling better oversight and ride allocation.

Report card - loading screen

Animations to build anticipation

Report card - performance indicators

The moment of truth

Report card - KPI screens

Clear and accurate feedback

Performance streaks

Gamification for sustained performance

Driver company dashboard

Solidifying the trust between SIXT and partner companies, foundation for future engagement

Explorations beyond current scope

Ideas

Social validation, abstracted ride value, gamification, recognition-based incentives, access privileges, relationship meters.

Key outcomes & impact

Performance data—sourced from GPS and app logs—was mapped to system-defined KPIs to evaluate each ride.
Ride Acceptance Rate was calculated as:


(Rides Accepted ÷ Rides Offered) × 100, reflecting driver trust and engagement.


From June to September 2020:


  • Ride acceptance rate improved by ~38.72%

  • Accepted rides grew from 1,801 to 4,625 (2.5×)

  • Perfect Rides increased 2.8×, from ~56% to ~61%


While ride demand was recovering post-COVID, average and poor rides stayed flat—confirming that quality gains came from behavior change, not just market rebound.

Driver survey highlights

User-centric design

Survey delivered via in-app notifications in 5 languages: English, German, French, Italian & Spanish. A total of 268 responses were received:

  • 82% of drivers are aware of their performance goals for every SIXT ride.

  • 70% found the ride report information helpful.

  • 40% credited the ride reports for their performance improvement.

Thanks for the read!

Launched & landed!

We launched a comprehensive in-app performance feedback system to improve driver trust and accountability without referencing payouts. Key features included:

  • Ride Report Cards – Rated each ride as Perfect, Average, or Poor based on tracked KPIs, and highlighted missed expectations with links to relevant guidelines.

  • Streaks – Motivated consistent high performance by visually rewarding consecutive quality rides.

  • Driver Company Dashboard – Gave partner companies visibility into individual and team-level performance, enabling better oversight and ride allocation.

Report card - loading screen

Animations to build anticipation

Report card - performance indicators

The moment of truth

Report card - KPI screens

Clear and accurate feedback

Performance streaks

Gamification for sustained performance

Driver company dashboard

Solidifying the trust between SIXT and partner companies, foundation for future engagement

Explorations beyond current scope

Ideas

Social validation, abstracted ride value, gamification, recognition-based incentives, access privileges, relationship meters.

Key outcomes & impact

Performance data—sourced from GPS and app logs—was mapped to system-defined KPIs to evaluate each ride.


Ride Acceptance Rate was calculated as:
(Rides Accepted ÷ Rides Offered) × 100, reflecting driver trust and engagement.


From June to September 2020:


  • Ride acceptance rate improved by ~38.72%

  • Accepted rides grew from 1,801 to 4,625 (2.5×)

  • Perfect Rides increased 2.8×, from ~56% to ~61%


While ride demand was recovering post-COVID, average and poor rides stayed flat—confirming that quality gains came from behavior change, not just market rebound.

Driver survey highlights

User-centric design

Survey delivered via in-app notifications in 5 languages: English, German, French, Italian & Spanish. A total of 268 responses were received:

  • 82% of drivers are aware of their performance goals for every SIXT ride.

  • 70% found the ride report information helpful.

  • 40% credited the ride reports for their performance improvement.

Thanks for the read!